


Objective
- Develop statewide predicted distribution models and maps for all 100 fish species in Nebraska.
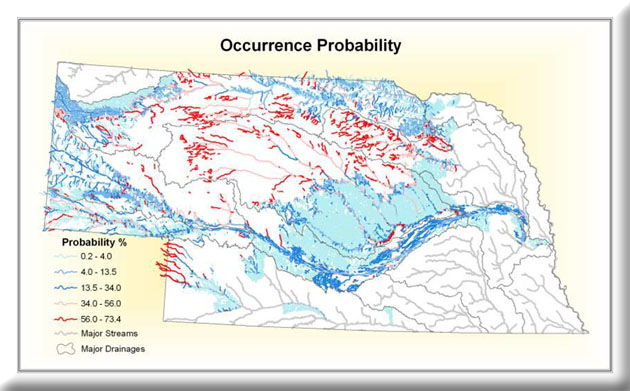
To construct the predictive fish distribution models, we first compiled 6,623 fish community collection records, which were obtained from field samples made by a variety of scientists between the years of 1857 and 2001. The collection records were then placed into a single relational database. Using ArcGIS, each collection in the database was then geographically linked, segment-by-segment to a modified version of the 1:100,000 National Hydrography Dataset (NHD) and the 1:100,000 USGS/NRCS 11-digit Hydrologic Unit (HU) coverage for Nebraska. Digital range maps, based on the 11-digit HUs, were constructed for each species, professionally reviewed, and revised as necessary. A total of 23 local and watershed attributes were quantified and attached to each of the 62,941 stream segments within the 1:100,000 modified NHD. These 23 attributes were used as the predictor variables for modeling the distribution of each fish species. Species distributions were modeled using Classification Tree analyses, which is a nonlinear/nonparametric modeling technique. The input dataset for each species consisted of all 6,623 collection records, which contained a binary response variable indicating the species presence or absence in each sample and the associated values for each of the 23 independent predictor variables.
Project completed July 2006.
Project Files
-
To request a final report or other documents available for this project click the link. Please include the name of the project in your request.
- MoRAP Contact Information